In a Jupyter environment, please rerun this cell to show the HTML representation or trust the notebook. On GitHub, the HTML representation is unable to render, please try loading this page with nbviewer.org.
In a Jupyter environment, please rerun this cell to show the HTML representation or trust the notebook. On GitHub, the HTML representation is unable to render, please try loading this page with nbviewer.org.
Lasso(alpha=1.1051709180756477, max_iter=10000)
Show/Hide
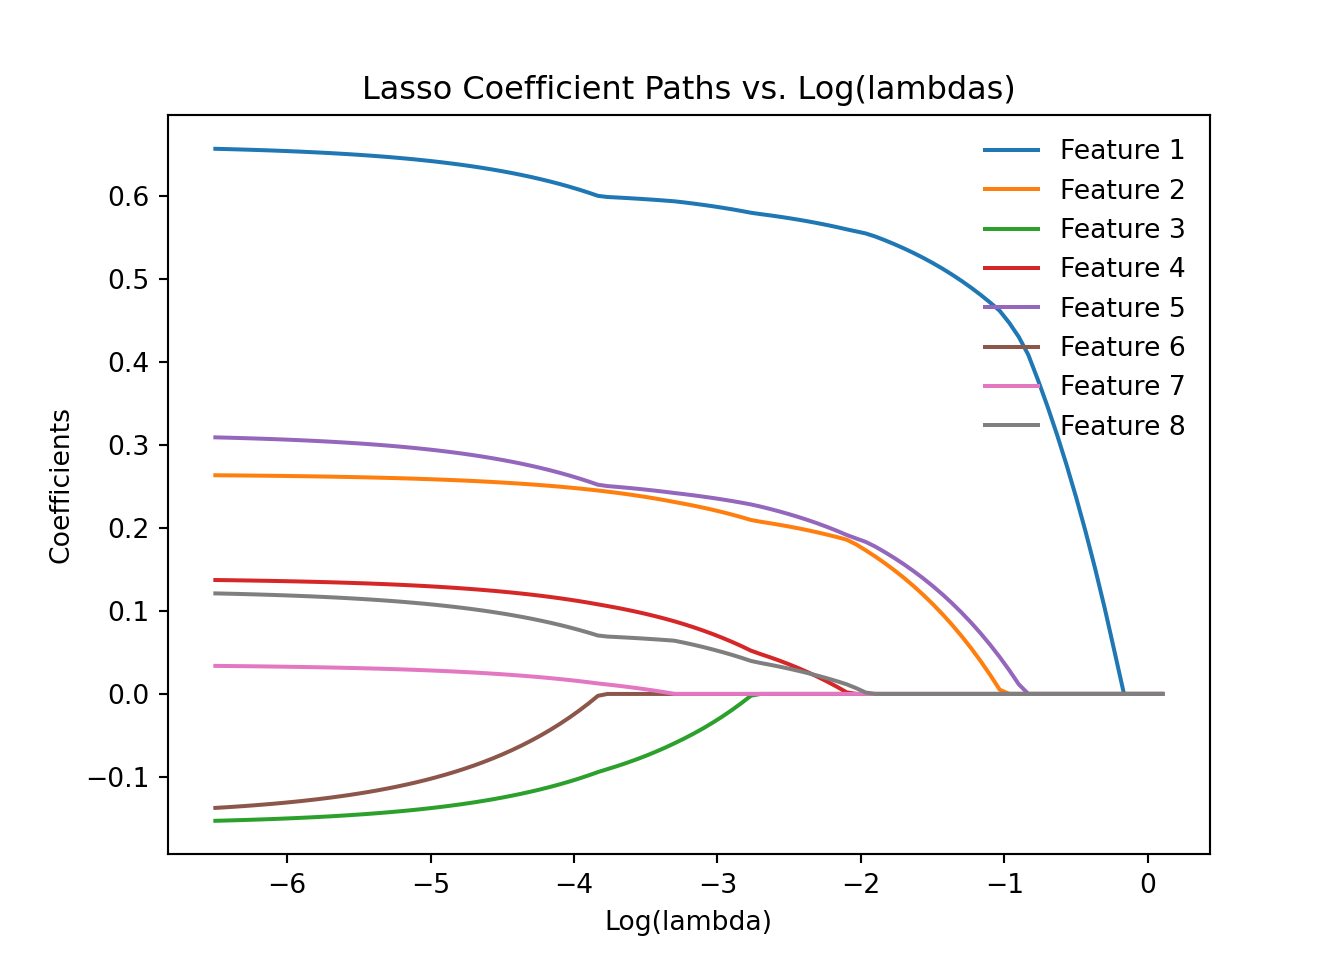
coefficients = np.array(coefficients)# Plot coefficient pathsfor i inrange(coefficients.shape[1]): plt.plot(np.log(lambdas), coefficients[:, i], label=f"Feature {i+1}")plt.xlabel("Log(lambda)")plt.ylabel("Coefficients")plt.title("Lasso Coefficient Paths vs. Log(lambdas)")plt.legend(loc="upper right", frameon=False)plt.show()
In a Jupyter environment, please rerun this cell to show the HTML representation or trust the notebook. On GitHub, the HTML representation is unable to render, please try loading this page with nbviewer.org.