13 - Support Vector Machine Code Demo
1 R implementation
1.1 Linear kernel
Code
svm_fit <- e1071::svm(y ~ ., data = data.frame(x, y), type = 'C-classification',
                      kernel = 'linear', scale = FALSE, cost = 10000)
Code
svm_fit2 <- kernlab::ksvm(x, y, type = "C-svc", kernel = 'vanilladot', C = 10000) Setting default kernel parameters 1.2 Radial basis (Gaussian) kernel
Code
load("../data/ESL.mixture.rda", verbose = TRUE)Loading objects:
ESL.mixtureCode
x <- ESL.mixture$x
y <- ESL.mixture$y
dat <- data.frame(y = factor(y), x)
fit <- svm(y ~ ., data = dat, scale = FALSE, kernel = "radial", cost = 5)
Code
px1 <- ESL.mixture$px1
px2 <- ESL.mixture$px2
xgrid <- expand.grid(X1 = px1, X2 = px2)
func <- predict(fit, xgrid, decision.values = TRUE)
func <- attributes(func)$decision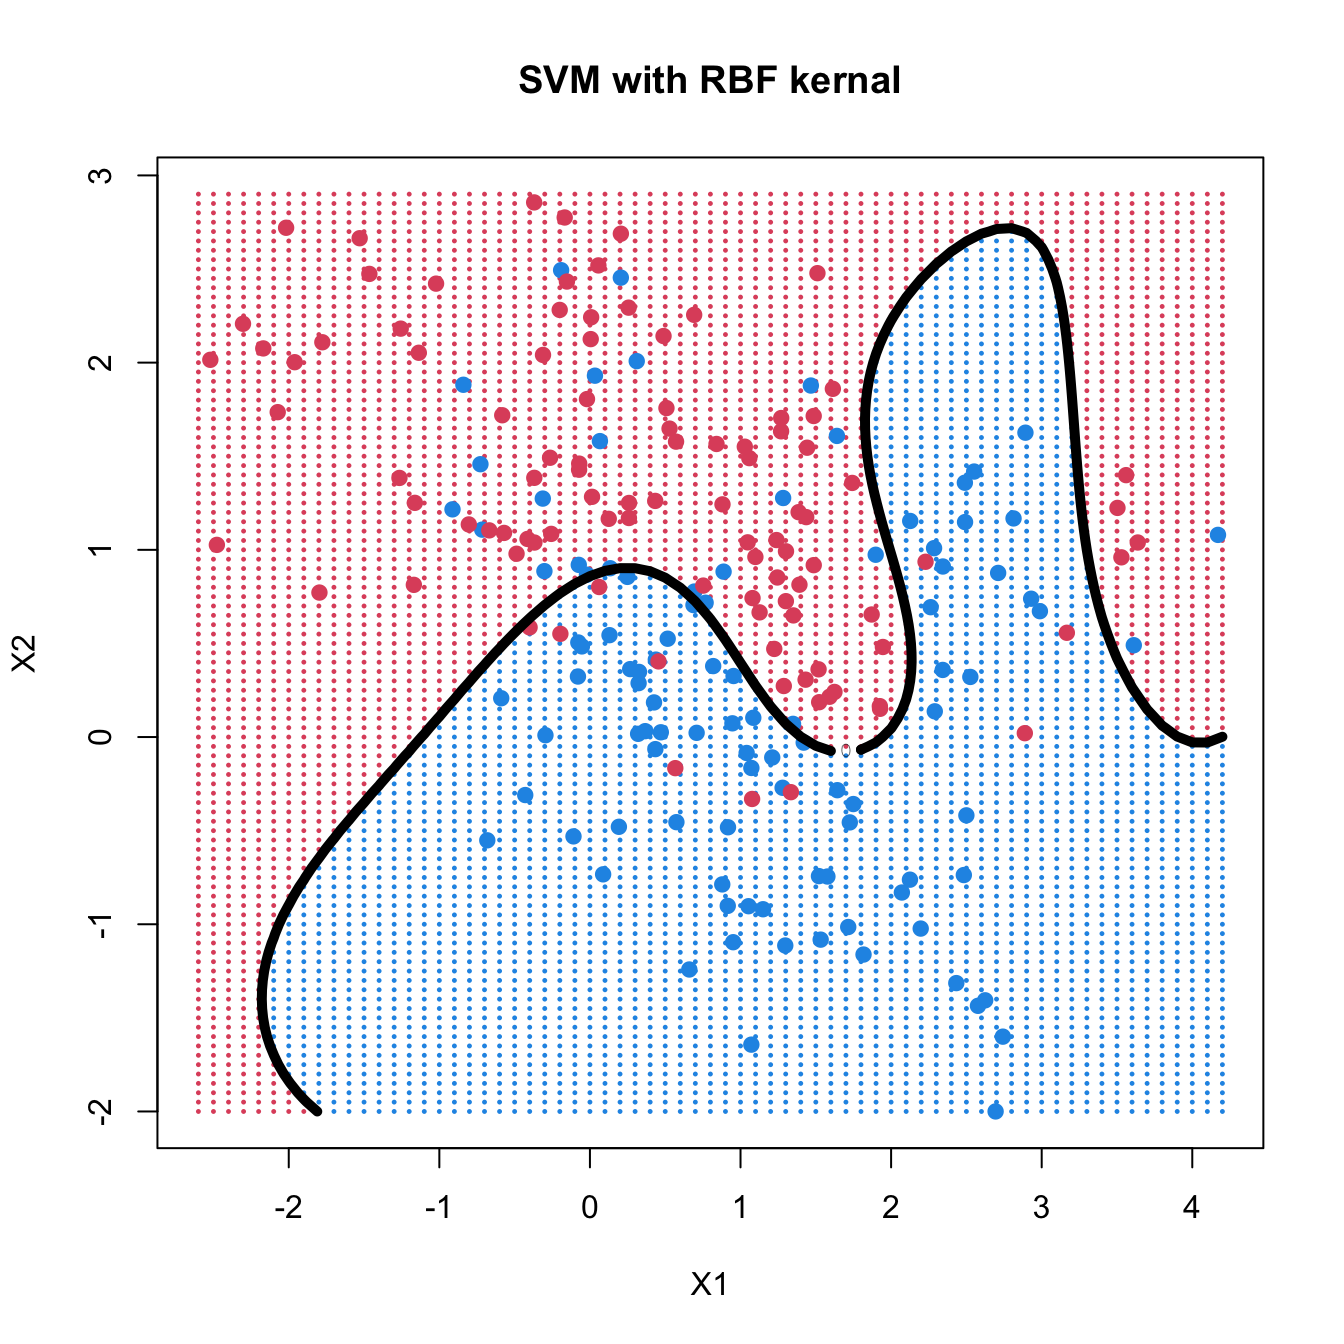
2 Python implementation
Code
import numpy as np
import matplotlib.pyplot as plt
from sklearn.svm import SVC
2.1 Linear kernel
Code
np.random.seed(1)
n = 6
p = 2
xneg = np.random.normal(size=(n, p))
xpos = np.random.normal(loc=3, size=(n, p))
x = np.vstack((xpos, xneg))
y = np.array([1] * n + [-1] * n)
Code
svm_fit = SVC(kernel="linear", C=10000, probability=True)
svm_fit.fit(x, y)
SVC(C=10000, kernel='linear', probability=True)In a Jupyter environment, please rerun this cell to show the HTML representation or trust the notebook.
On GitHub, the HTML representation is unable to render, please try loading this page with nbviewer.org.
SVC(C=10000, kernel='linear', probability=True)
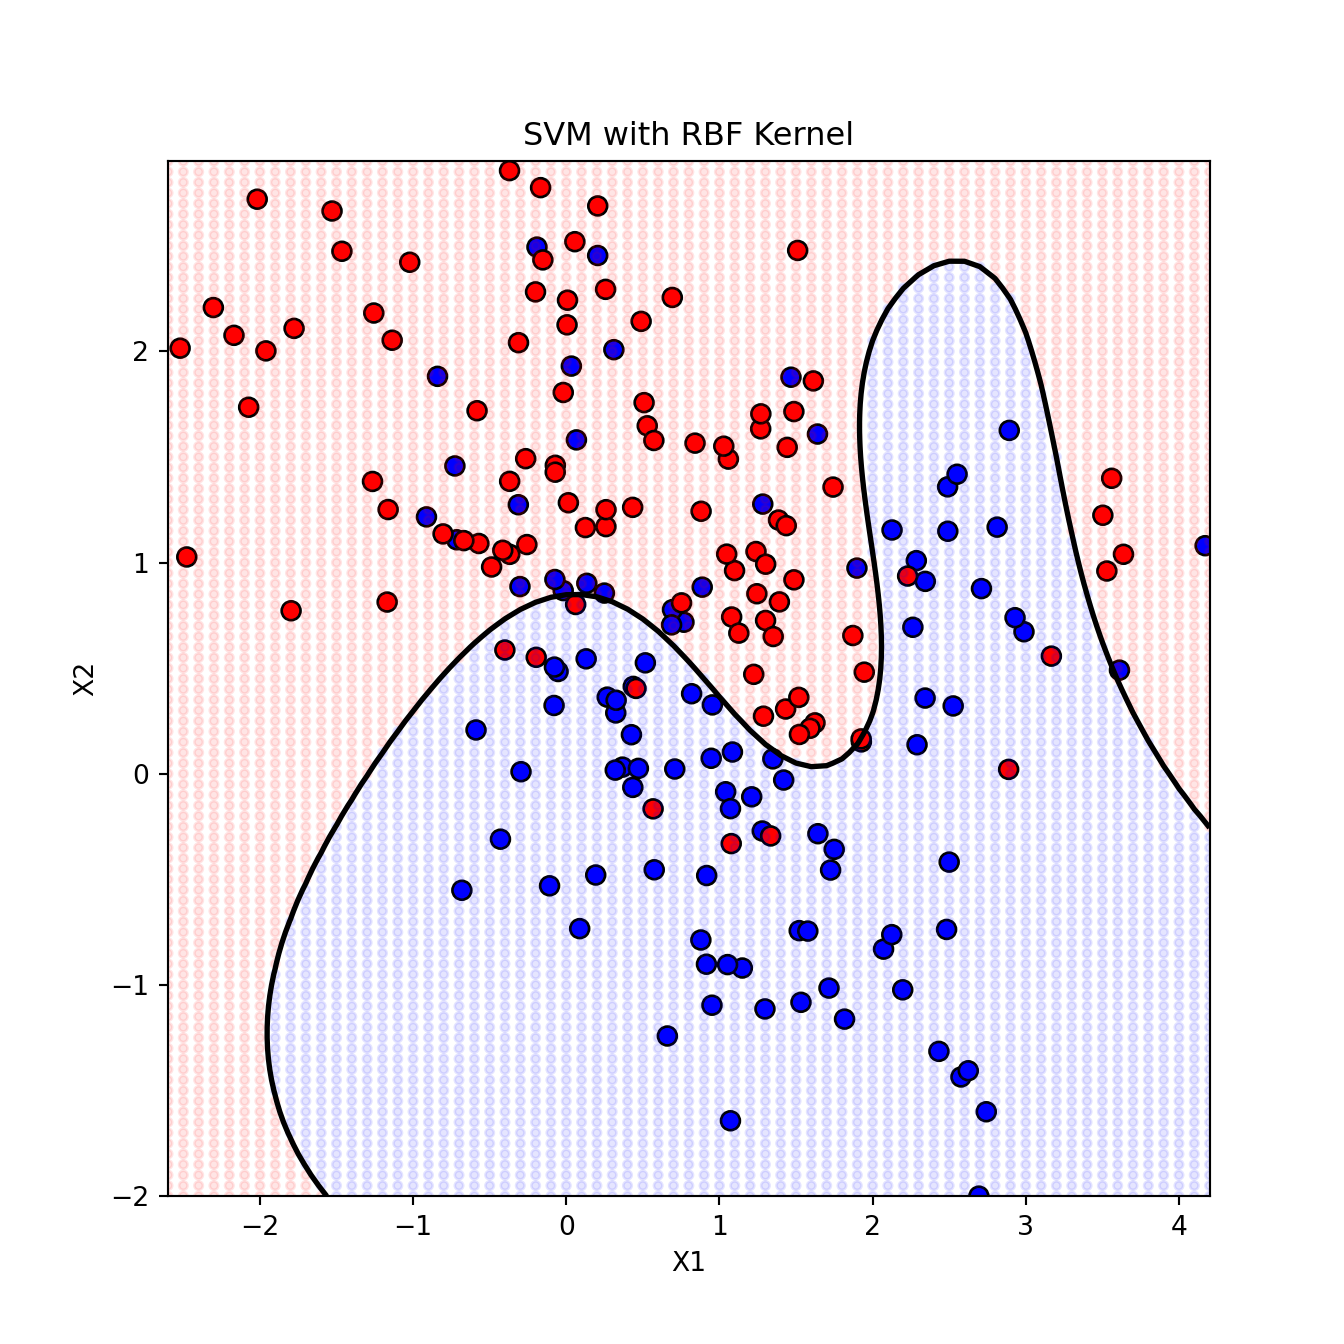
2.2 Radial basis (Gaussian) kernel
Code
import rdata
mixture_example = rdata.read_rda('../data/ESL.mixture.rda')
/Users/chenghanyu/.virtualenvs/r-reticulate/lib/python3.12/site-packages/rdata/conversion/_conversion.py:856: UserWarning: Missing constructor for R class "matrix". The underlying R object is returned instead.
warnings.warn(Code
x = mixture_example['ESL.mixture']['x']
y = mixture_example['ESL.mixture']['y']
Code
svm_rbf = SVC(kernel = 'rbf', C = 5, probability = True)
svm_rbf.fit(x, y)
SVC(C=5, probability=True)In a Jupyter environment, please rerun this cell to show the HTML representation or trust the notebook.
On GitHub, the HTML representation is unable to render, please try loading this page with nbviewer.org.
SVC(C=5, probability=True)
Code
px1 = mixture_example['ESL.mixture']['px1']
px2 = mixture_example['ESL.mixture']['px2']
ppx1, ppx2 = np.meshgrid(px1, px2)
x_grid = np.c_[ppx1.ravel(), ppx2.ravel()]
decision_function = svm_rbf.decision_function(x_grid).reshape(ppx1.shape)
probability = svm_rbf.predict_proba(x_grid)[:, 1].reshape(ppx1.shape)
Code
plt.figure()
plt.contour(px1, px2, decision_function, levels=[0], colors="black", linewidths=2)
plt.scatter(x[:, 0], x[:, 1], c=y, cmap="bwr", s=50, edgecolor="k")
plt.scatter(x_grid[:, 0], x_grid[:, 1],
            c=np.where(probability.ravel() >= 0.5, "red", "blue"), s=10, alpha=0.1)
plt.title("SVM with RBF Kernel")
plt.xlabel("X1")
plt.ylabel("X2")
plt.show()