R implementation
Code
               Murder Assault UrbanPop Rape
Alabama          13.2     236       58 21.2
Alaska           10.0     263       48 44.5
Arizona           8.1     294       80 31.0
Arkansas          8.8     190       50 19.5
California        9.0     276       91 40.6
Colorado          7.9     204       78 38.7
Connecticut       3.3     110       77 11.1
Delaware          5.9     238       72 15.8
Florida          15.4     335       80 31.9
Georgia          17.4     211       60 25.8
Hawaii            5.3      46       83 20.2
Idaho             2.6     120       54 14.2
Illinois         10.4     249       83 24.0
Indiana           7.2     113       65 21.0
Iowa              2.2      56       57 11.3
Kansas            6.0     115       66 18.0
Kentucky          9.7     109       52 16.3
Louisiana        15.4     249       66 22.2
Maine             2.1      83       51  7.8
Maryland         11.3     300       67 27.8
Massachusetts     4.4     149       85 16.3
Michigan         12.1     255       74 35.1
Minnesota         2.7      72       66 14.9
Mississippi      16.1     259       44 17.1
Missouri          9.0     178       70 28.2
Montana           6.0     109       53 16.4
Nebraska          4.3     102       62 16.5
Nevada           12.2     252       81 46.0
New Hampshire     2.1      57       56  9.5
New Jersey        7.4     159       89 18.8
New Mexico       11.4     285       70 32.1
New York         11.1     254       86 26.1
North Carolina   13.0     337       45 16.1
North Dakota      0.8      45       44  7.3
Ohio              7.3     120       75 21.4
Oklahoma          6.6     151       68 20.0
Oregon            4.9     159       67 29.3
Pennsylvania      6.3     106       72 14.9
Rhode Island      3.4     174       87  8.3
South Carolina   14.4     279       48 22.5
South Dakota      3.8      86       45 12.8
Tennessee        13.2     188       59 26.9
Texas            12.7     201       80 25.5
Utah              3.2     120       80 22.9
Vermont           2.2      48       32 11.2
Virginia          8.5     156       63 20.7
Washington        4.0     145       73 26.2
West Virginia     5.7      81       39  9.3
Wisconsin         2.6      53       66 10.8
Wyoming           6.8     161       60 15.6
Code pca_output <- prcomp ( USArrests , scale = TRUE )
Code ( pca_output $ rotation <- - pca_output $ rotation )
               PC1        PC2        PC3         PC4
Murder   0.5358995  0.4181809 -0.3412327 -0.64922780
Assault  0.5831836  0.1879856 -0.2681484  0.74340748
UrbanPop 0.2781909 -0.8728062 -0.3780158 -0.13387773
Rape     0.5434321 -0.1673186  0.8177779 -0.08902432
Code
                       PC1         PC2         PC3          PC4
Alabama        -0.97566045 -1.12200121  0.43980366  0.154696581
Alaska         -1.93053788 -1.06242692 -2.01950027 -0.434175454
Arizona        -1.74544285  0.73845954 -0.05423025 -0.826264240
Arkansas        0.13999894 -1.10854226 -0.11342217 -0.180973554
California     -2.49861285  1.52742672 -0.59254100 -0.338559240
Colorado       -1.49934074  0.97762966 -1.08400162  0.001450164
Connecticut     1.34499236  1.07798362  0.63679250 -0.117278736
Delaware       -0.04722981  0.32208890  0.71141032 -0.873113315
Florida        -2.98275967 -0.03883425  0.57103206 -0.095317042
Georgia        -1.62280742 -1.26608838  0.33901818  1.065974459
Hawaii          0.90348448  1.55467609 -0.05027151  0.893733198
Idaho           1.62331903 -0.20885253 -0.25719021 -0.494087852
Illinois       -1.36505197  0.67498834  0.67068647 -0.120794916
Indiana         0.50038122  0.15003926 -0.22576277  0.420397595
Iowa            2.23099579  0.10300828 -0.16291036  0.017379470
Kansas          0.78887206  0.26744941 -0.02529648  0.204421034
Kentucky        0.74331256 -0.94880748  0.02808429  0.663817237
Louisiana      -1.54909076 -0.86230011  0.77560598  0.450157791
Maine           2.37274014 -0.37260865  0.06502225 -0.327138529
Maryland       -1.74564663 -0.42335704  0.15566968 -0.553450589
Massachusetts   0.48128007  1.45967706  0.60337172 -0.177793902
Michigan       -2.08725025  0.15383500 -0.38100046  0.101343128
Minnesota       1.67566951  0.62590670 -0.15153200  0.066640316
Mississippi    -0.98647919 -2.36973712  0.73336290  0.213342049
Missouri       -0.68978426  0.26070794 -0.37365033  0.223554811
Montana         1.17353751 -0.53147851 -0.24440796  0.122498555
Nebraska        1.25291625  0.19200440 -0.17380930  0.015733156
Nevada         -2.84550542  0.76780502 -1.15168793  0.311354436
New Hampshire   2.35995585  0.01790055 -0.03648498 -0.032804291
New Jersey     -0.17974128  1.43493745  0.75677041  0.240936580
New Mexico     -1.96012351 -0.14141308 -0.18184598 -0.336121113
New York       -1.66566662  0.81491072  0.63661186 -0.013348844
North Carolina -1.11208808 -2.20561081  0.85489245 -0.944789648
North Dakota    2.96215223 -0.59309738 -0.29824930 -0.251434626
Ohio            0.22369436  0.73477837  0.03082616  0.469152817
Oklahoma        0.30864928  0.28496113  0.01515592  0.010228476
Oregon         -0.05852787  0.53596999 -0.93038718 -0.235390872
Pennsylvania    0.87948680  0.56536050  0.39660218  0.355452378
Rhode Island    0.85509072  1.47698328  1.35617705 -0.607402746
South Carolina -1.30744986 -1.91397297  0.29751723 -0.130145378
South Dakota    1.96779669 -0.81506822 -0.38538073 -0.108470512
Tennessee      -0.98969377 -0.85160534 -0.18619262  0.646302674
Texas          -1.34151838  0.40833518  0.48712332  0.636731051
Utah            0.54503180  1.45671524 -0.29077592 -0.081486749
Vermont         2.77325613 -1.38819435 -0.83280797 -0.143433697
Virginia        0.09536670 -0.19772785 -0.01159482  0.209246429
Washington      0.21472339  0.96037394 -0.61859067 -0.218628161
West Virginia   2.08739306 -1.41052627 -0.10372163  0.130583080
Wisconsin       2.05881199  0.60512507  0.13746933  0.182253407
Wyoming         0.62310061 -0.31778662  0.23824049 -0.164976866
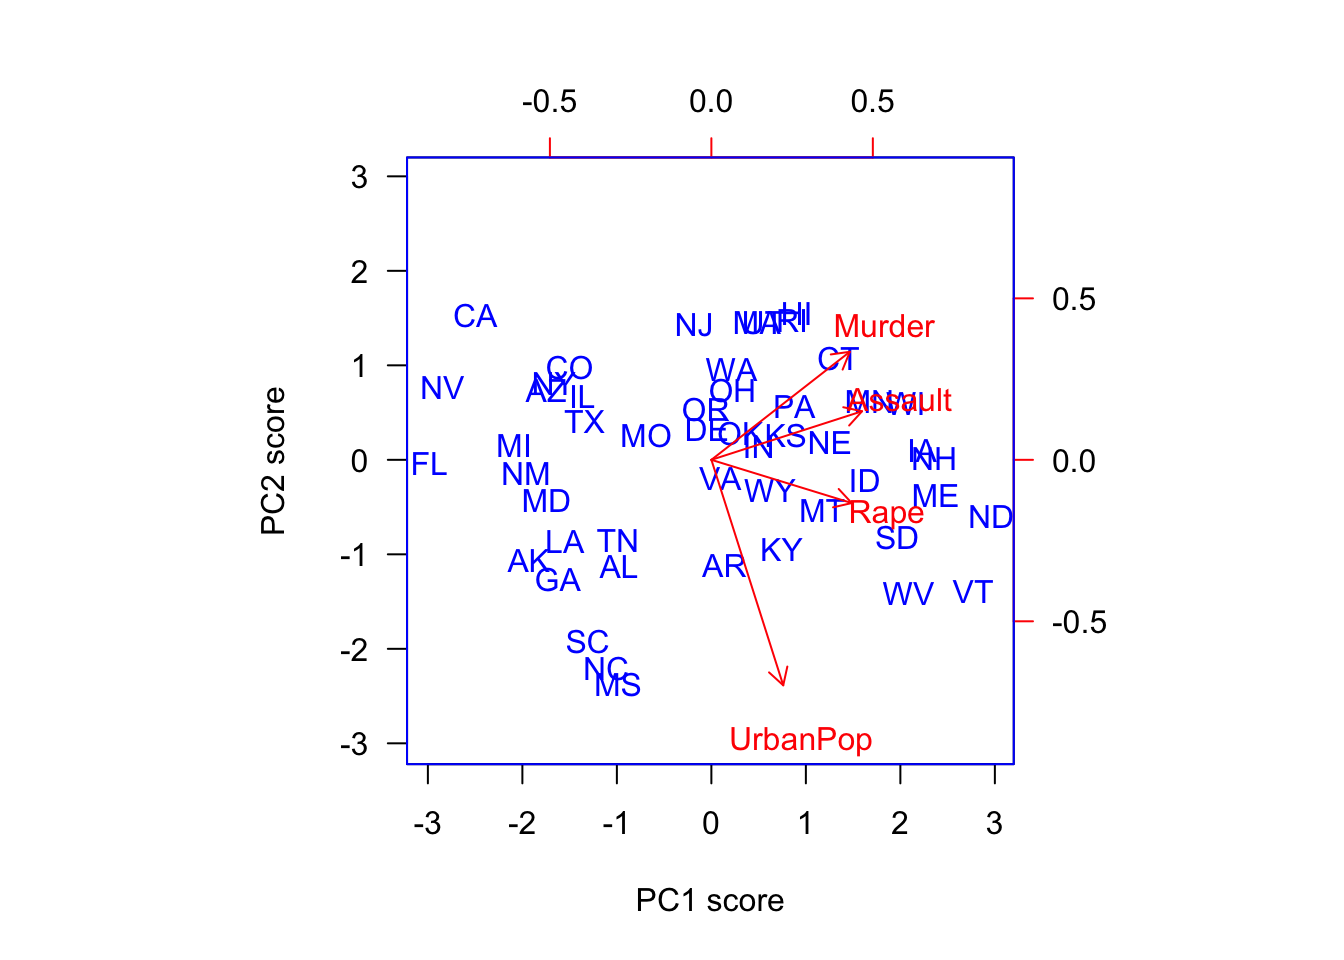
Code biplot ( pca_output , xlabs = state.abb , scale = 0 , col = c ( "blue" , "red" ) , las = 1 ,
xlab = "PC1 score" , ylab = "PC2 score" )
Code ( pc_var <- pca_output $ sdev ^ 2 )
[1] 2.4802416 0.9897652 0.3565632 0.1734301
Code ( pc_var_prop <- pc_var / sum ( pc_var ) )
[1] 0.62006039 0.24744129 0.08914080 0.04335752
Python implementation
The biplot in Python needs extra work. We need to either write our own function or rely on some other packages such as pca
Code import numpy as npimport pandas as pdfrom sklearn.decomposition import PCAfrom sklearn.preprocessing import StandardScaler
Code = pd.read_csv('../data/USArrests.csv' )
Code = USArrests.drop(['rownames' ], axis = 1 )= USArrests['rownames' ]
                Murder  Assault  UrbanPop  Rape
rownames
Alabama           13.2      236        58  21.2
Alaska            10.0      263        48  44.5
Arizona            8.1      294        80  31.0
Arkansas           8.8      190        50  19.5
California         9.0      276        91  40.6
Colorado           7.9      204        78  38.7
Connecticut        3.3      110        77  11.1
Delaware           5.9      238        72  15.8
Florida           15.4      335        80  31.9
Georgia           17.4      211        60  25.8
Hawaii             5.3       46        83  20.2
Idaho              2.6      120        54  14.2
Illinois          10.4      249        83  24.0
Indiana            7.2      113        65  21.0
Iowa               2.2       56        57  11.3
Kansas             6.0      115        66  18.0
Kentucky           9.7      109        52  16.3
Louisiana         15.4      249        66  22.2
Maine              2.1       83        51   7.8
Maryland          11.3      300        67  27.8
Massachusetts      4.4      149        85  16.3
Michigan          12.1      255        74  35.1
Minnesota          2.7       72        66  14.9
Mississippi       16.1      259        44  17.1
Missouri           9.0      178        70  28.2
Montana            6.0      109        53  16.4
Nebraska           4.3      102        62  16.5
Nevada            12.2      252        81  46.0
New Hampshire      2.1       57        56   9.5
New Jersey         7.4      159        89  18.8
New Mexico        11.4      285        70  32.1
New York          11.1      254        86  26.1
North Carolina    13.0      337        45  16.1
North Dakota       0.8       45        44   7.3
Ohio               7.3      120        75  21.4
Oklahoma           6.6      151        68  20.0
Oregon             4.9      159        67  29.3
Pennsylvania       6.3      106        72  14.9
Rhode Island       3.4      174        87   8.3
South Carolina    14.4      279        48  22.5
South Dakota       3.8       86        45  12.8
Tennessee         13.2      188        59  26.9
Texas             12.7      201        80  25.5
Utah               3.2      120        80  22.9
Vermont            2.2       48        32  11.2
Virginia           8.5      156        63  20.7
Washington         4.0      145        73  26.2
West Virginia      5.7       81        39   9.3
Wisconsin          2.6       53        66  10.8
Wyoming            6.8      161        60  15.6
Code = StandardScaler()= scaler.fit_transform(USArr.values) ## Array
Code = PCA(n_components= 4 )
PCA(n_components=4)
In a Jupyter environment, please rerun this cell to show the HTML representation or trust the notebook.
Code = ['PC1' , 'PC2' , 'PC3' , 'PC4' ],= USArr.columns)
               PC1       PC2       PC3       PC4
Murder    0.535899  0.418181 -0.341233  0.649228
Assault   0.583184  0.187986 -0.268148 -0.743407
UrbanPop  0.278191 -0.872806 -0.378016  0.133878
Rape      0.543432 -0.167319  0.817778  0.089024
Code = ['PC1' , 'PC2' , 'PC3' , 'PC4' ], = USArr.index)
                     PC1       PC2       PC3       PC4
rownames
Alabama         0.985566  1.133392 -0.444269  0.156267
Alaska          1.950138  1.073213  2.040003 -0.438583
Arizona         1.763164 -0.745957  0.054781 -0.834653
Arkansas       -0.141420  1.119797  0.114574 -0.182811
California      2.523980 -1.542934  0.598557 -0.341996
Colorado        1.514563 -0.987555  1.095007  0.001465
Connecticut    -1.358647 -1.088928 -0.643258 -0.118469
Delaware        0.047709 -0.325359 -0.718633 -0.881978
Florida         3.013042  0.039229 -0.576829 -0.096285
Georgia         1.639283  1.278942 -0.342460  1.076797
Hawaii         -0.912657 -1.570460  0.050782  0.902807
Idaho          -1.639800  0.210973  0.259801 -0.499104
Illinois        1.378911 -0.681841 -0.677496 -0.122021
Indiana        -0.505461 -0.151563  0.228055  0.424666
Iowa           -2.253646 -0.104054  0.164564  0.017556
Kansas         -0.796881 -0.270165  0.025553  0.206496
Kentucky       -0.750859  0.958440 -0.028369  0.670557
Louisiana       1.564818  0.871055 -0.783480  0.454728
Maine          -2.396829  0.376392 -0.065682 -0.330460
Maryland        1.763369  0.427655 -0.157250 -0.559070
Massachusetts  -0.486166 -1.474496 -0.609497 -0.179599
Michigan        2.108441 -0.155397  0.384869  0.102372
Minnesota      -1.692682 -0.632261  0.153070  0.067317
Mississippi     0.996494  2.393796 -0.740808  0.215508
Missouri        0.696787 -0.263355  0.377444  0.225824
Montana        -1.185452  0.536874  0.246889  0.123742
Nebraska       -1.265637 -0.193954  0.175574  0.015893
Nevada          2.874395 -0.775600  1.163380  0.314515
New Hampshire  -2.383915 -0.018082  0.036855 -0.033137
New Jersey      0.181566 -1.449506 -0.764454  0.243383
New Mexico      1.980024  0.142849  0.183692 -0.339534
New York        1.682577 -0.823184 -0.643075 -0.013484
North Carolina  1.123379  2.228003 -0.863572 -0.954382
North Dakota   -2.992226  0.599119  0.301277 -0.253987
Ohio           -0.225965 -0.742238 -0.031139  0.473916
Oklahoma       -0.311783 -0.287854 -0.015310  0.010332
Oregon          0.059122 -0.541411  0.939833 -0.237781
Pennsylvania   -0.888416 -0.571100 -0.400629  0.359061
Rhode Island   -0.863772 -1.491978 -1.369946 -0.613569
South Carolina  1.320724  1.933405 -0.300538 -0.131467
South Dakota   -1.987775  0.823343  0.389293 -0.109572
Tennessee       0.999742  0.860251  0.188083  0.652864
Texas           1.355138 -0.412481 -0.492069  0.643195
Utah           -0.550565 -1.471505  0.293728 -0.082314
Vermont        -2.801412  1.402288  0.841263 -0.144890
Virginia       -0.096335  0.199735  0.011713  0.211371
Washington     -0.216903 -0.970124  0.624871 -0.220848
West Virginia  -2.108585  1.424847  0.104775  0.131909
Wisconsin      -2.079714 -0.611269 -0.138865  0.184104
Wyoming        -0.629427  0.321013 -0.240659 -0.166652
Code
array([2.53085875, 1.00996444, 0.36383998, 0.17696948])